Having created a comprehensive set of code tests for the Router (which we'll write about in this series soon) we were reasonably confident that it would do the right job in production. But "reasonably confident" isn't good enough; we wanted to be sure. So we took some steps to further validate the solution.
Feature flags
One of the first things I implemented was a set of feature flags to switch the new Router on and off. There were two kinds of flags in use up until the go live date:
One was in Puppet, which configures Nginx and Varnish upstream of the Router in the GOV.UK stack. Switching this on delegated all routing and redirect handling to the Router. It could be flipped on and off quickly, without a full promotion and deployment of our normal configuration management repository, and on an per-environment basis. This allowed us to put the Router into full service for some environments (like development) and quickly turn it off should we discover any serious regressions.
The other feature flag was placed within the running configurations of Nginx and Varnish. By providing a custom HTTP header a request could opt-in to be handled by the Router. This allowed us to dark launch the project in production very early on and was used throughout the tests described further below.
Synthetic A/B tests
The next step was to test that the Router behaved the same in a real environment as the solution it was replacing. To do this I used the HTTP header feature flag and Multi-Mechanize (thanks to @jgumbley for introducing me).
Multi-Mechanize test scripts are written as Python classes. The class is instantiated once for each thread and then a method of that class is called many times for the duration of the test. Being pure Python you have the ability to do pretty much anything, making it very flexible.
I created a script which loaded a large list of URLs sampled from our access logs in Kibana/Elasticsearch. On each loop it would select a URL from the list at random, request the URL with and without the feature flag, make some assertions based on the two response bodies and status codes, and record the response time of each into a custom timer.
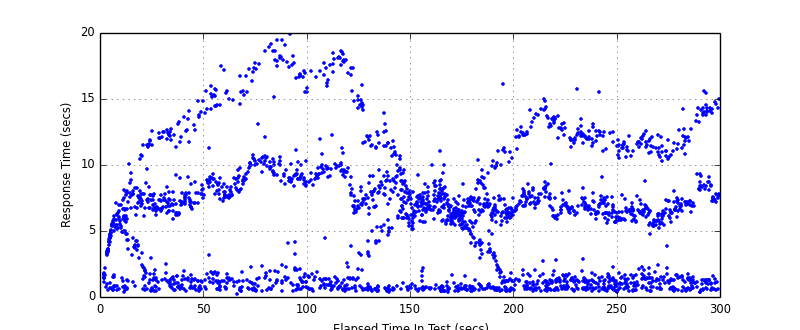
The assertions validated that the Router wasn't altering the content of responses in any unexpected way. The custom timers and beautiful matplotlib graphs that are generated in the reports demonstrated that the Router wasn't adding any appreciable latency to requests.
Whilst the average and percentile graphs were useful when reviewing this, I especially like the raw plot of response times. It reads like a heatmap and is great for visualising the distribution and different strata of response times which would otherwise be masked averaging. Misbehaving backends are a perfect example.
Replay production traffic
Synthetic tests can be useful, but they are no substitute for the real thing. It's just not possible to synthesise the variation of traffic that you'll see in production. Humans, browsers, and robots all do strange things to affect the frequency of requests, URL weighting, size of headers, etc. We wanted to be sure that we weren't tripped up by an edge-case that only presented itself after we'd gone live.
I investigated a few possible solutions to this:
- Layer 7 "tee-ing" with a reverse proxy that would duplicate each request to a second backend. Unfortunately Nginx and Varnish don't provide this exact functionality. There are some projects like em-proxy that work by inserting an additional reverse-proxy in the request handling chain, however placing another component in the critical-path of production traffic was too risky.
- Layer 2 "tee-ing" with tcprelay or iptables/netfilter's
TEEtarget. These were deemed not suitable because of the complexity of packet routing between environments and incorrect source addresses. - Varnish ships with a utility called varnishreplay which can be fed the output of varnishlog, to passively capture and replay requests between two Varnish instances. However it seems to be a rather neglected part of the Varnish suite and I couldn't get it to work.
Eventually I came across a project called Gor. It passively captures HTTP traffic from the wire using raw sockets. The captured traffic can either be forwarded over the network to another environment and replayed in realtime, or dumped to a file from which it will be replayed with respect to the original timing differences between requests.
After contributing some patches to the project to inject custom headers and improve the reliability of file-based replay, I set it up to capture production HTTP traffic between Nginx and Varnish on the loopback interface. These captures were then replayed against our staging environment with the addition of the extra header.
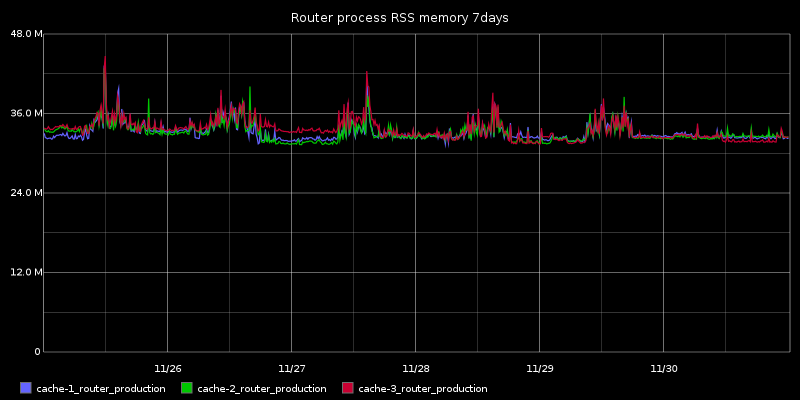
Doing this enabled us to put the Router "into production" a long time before we were entirely comfortable that it was "production ready" and without any risk. We could tell that it was doing the right thing from the access logs/stats of the reverse-proxies above and the Router's own error logs. By leaving this in place for several days and weeks we also soak tested the Router and confirmed that CPU and memory usage remained within sensible bounds over a longer period of time.
Performance, capacity, regressions
Having determined that the functionality and performance of the Router had been satisfactory to-date we started to look further ahead at capacity planning, edge cases that might affect performance, and preventing any regressions. We needed to answer some key questions:
- How many requests per-second can be handled?
- How many concurrent requests can be handled?
- How much latency (precisely) is added to requests?
- Is performance affected by route reloading or slow/down backends?
I didn't consider Multi-Mechanize, or the old favourites siege and ab, quite suitable for this task.
Speed was a major factor and it mostly came down to threading implementations. Specifying a concurrency count makes it very difficult to finely tune the request rate that a service will be subjected to. It can vary wildly depending on the machine resources and network connectivity of the machine you're running from. There is also a subtle gotcha when testing a service that may respond slowly. At least one of the client threads is going to be blocked waiting for a server response and cause overall throughput to drop as it's no longer able to contribute. You can try to maintain the request rate by timing out requests, but your response time data will suffer as a result.
Output formats were also a consideration. I wanted most of these tests to be initiated from an automated test suite so that they would be easily run by humans and frequently run by continuous integration. This would be key in safeguarding us from introducing performance regressions in future. As such the chosen tool needed to provide machine-parsable data that I could perform bounds checking and reporting from.
Next in my quest for suitable tools I came across a project called Vegeta. Like siege and ab you provide it a set of URLs, it will hit them, and report back how well it did. But instead of specifying the thread count you provide a requests per second rate and it will take care of the concurrency (using goroutines) needed to sustain that rate. In addition to a pretty HTML5 graph output it can also write the results in JSON.
Although Vegeta can be used as a library within Go, it made more sense to use it as a binary from our existing rspec test suite because we already had support to orchestrate the starting and loading of routes into the Router. Similarly the backends plumbed into the other side of the Router were also re-used from the existing suite because of existing orchestration and we were confident that Go's http.ListenAndServe() handler wouldn't be a bottleneck.
I created an rspec helper for Vegeta which provides some simple methods for generating traffic in the background against an endpoint and benchmarking an endpoint returning a hash of the results. All tests use a shared example which runs two benchmarks - against the raw backend and the same backend via the Router. By calculating the difference between the two results we can see the impact of the Router, irrespective of the performance of the machine that the tests were run on. Furthermore we ran both tests in parallel to ensure that the results weren't skewed by differences in machine load between the two runs.
The results demonstrated that the Router was plenty fast enough. Throughput was mostly constrained by whatever the values of ulimit file descriptor and thread restrictions were increased to. Latency increased by an average of just 100~200 μs. It was so small that we needed to adjust our tests to compare thresholds instead of percentages, because as my colleague noted "200% of nearly-zero is still nearly-zero".
Closing thoughts about Go
It's no coincidence that two of the tools we discovered and used during this project were written in Go, the same language as our Router. I attribute this to many of the same technical merits that we selected Go to build the Router.
It has incredibly strong HTTP support in the standard library. It's easy to use; as somebody that doesn't primarily identify as a developer I had very little trouble bolting components together or modifying them to suit my requirements. The portability of a single statically linked binary appeals to my sysadmin background. Concurrency works just as advertised. And of course it runs exceptionally fast; this was the first time that I've needed to rationalise benchmarks in the order of nanoseconds and microseconds (thanks @ripienaar).
If work like this sounds good for you, take a look at Working for GDS - we're usually in search of talented people to come and join the team.
You can follow Dan on twitter, sign up now for email updates from this blog or subscribe to the feed.


1 comment
Comment by Tomás Senart posted on
Hey there,
Very interesting use of Vegeta here! I was thinking that it would make a lot of sense to run these performance tests regularly (through some Jenkins integration) against the production systems as well in order to test real network latency and other metrics under normal user load.