As developers of web pages, we spend a lot of time using our browsers to inspect their HTML, CSS and JavaScript. The developer tools that come with modern browsers are therefore one of our most-used tools, Google Chrome’s in particular.
We’ve been spending some time recently talking about how we use them around GDS, swapping tips and sharing process. In addition to this we asked @umarhansa, a contributor to Chrome’s developer tools documentation, to show us the most useful features.
We thought it was worth sharing a few of the best learnings. A lot of the tips below are quite new so it’s best to try them in Canary, the version of Chrome used for testing new features.
General tips
Search all files used by a page
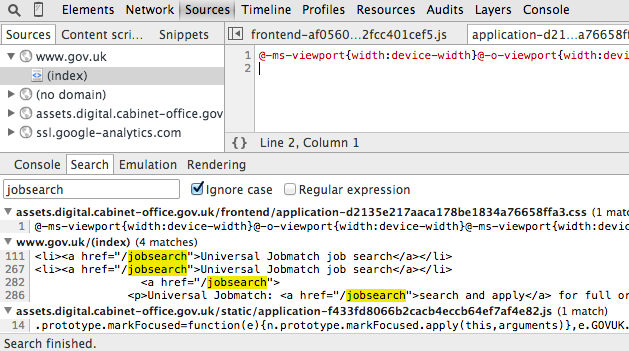
When viewing files in the source panel you can get a global search of all files used by pressing escape and selecting the 'search' tab from the panel that pops up.
Version history
If you right-click in an file you’ve been working in and select 'local modifications' you will see a full history of all changes made.
Storing JavaScript variables for later
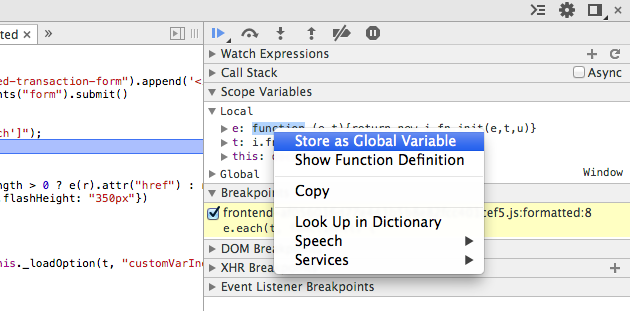
If you right-click on a variable while debugging JavaScript you'll get the option to 'Set as global'. This allows you to store the value outside of the scope in which you found it for inspecting later.
Colour picker
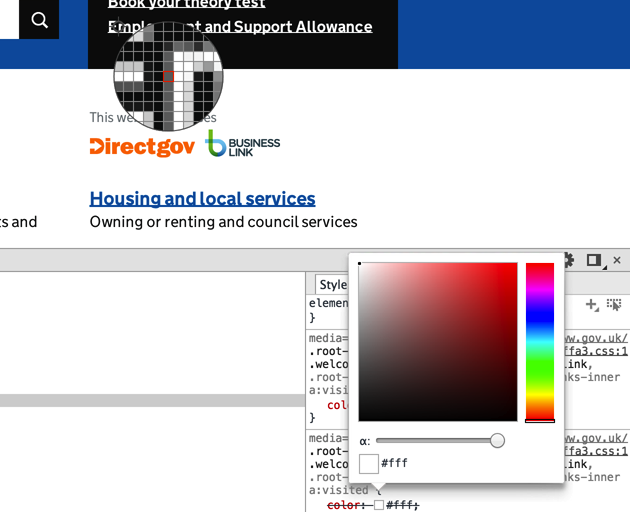
Every colour value in the styles for an inspected element has a swatch of the actual colour. If you click on the swatch you’ll get a popup for choosing colours. If you then run the cursor over the web page you'll get a colour picker to choosing colours from the page.
Saving changes to files
One common workflow we have is to use developer tools to make changes to pages in-browser, enabling us to test designs or production code on live pages. One of the frustrations often mentioned was that there was no easy way to save the changes made.
A few recent additions to the tools provide some remedy to this.
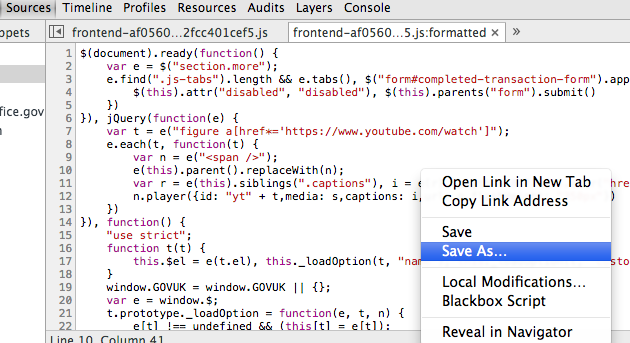
For a start, any files you edit can now be saved to your machine by right-clicking in any file and selecting ‘Save as’.
Workspaces
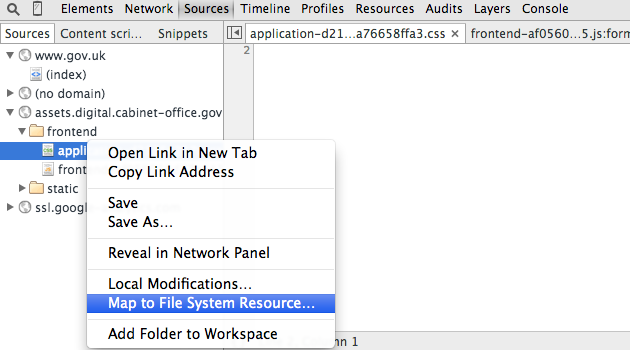
Originally introduced to us by my colleague @_ralph, workspaces provides a more comprehensive solution.
Using workspaces you can add a folder on your machine to those included by developer tools (shown in the right-hand panel of the ‘sources’ tab). Once done, you can map files in your folder to those used by the page, allowing all changes to be saved in a way you can easily come back to later.
Responsive design
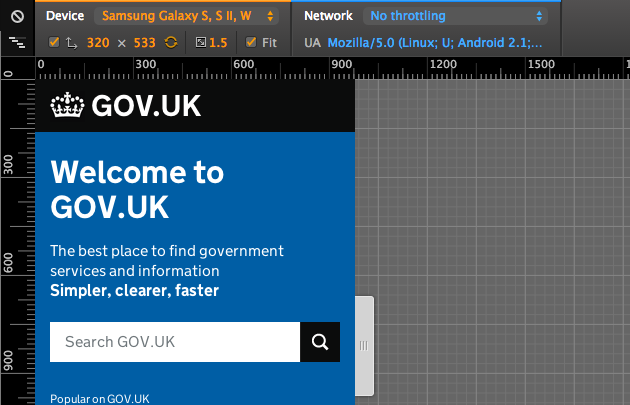
The responsive design view, similar to that found in Firefox, allows simulation of the most popular devices. It’s not the same as a real device because they don’t use the same rendering engine or run on the same hardware, but the following features do make it useful for testing:
- preset screen sizes for most common devices
- touch simulation
- device pixel simulation & zoom
- user agent spoofing
- simulating different network speeds
Slides for Umar’s session, showing the above tips and more can be found on github: http://umaar.github.io/devtools-talk-aug-2014/assets/player/KeynoteDHTMLPlayer.html.
If this sounds like a good place to work, take a look at Working for GDS - we're usually in search of talented people to come and join the team.
You can follow Tom on Twitter, sign up now for email updates from this blog or subscribe to the feed.


2 comments
Comment by Morten Andersen posted on
For a front end coder this is a nice reading. Hope you will share some more dev tools tips in the future
Comment by Denis posted on
Thank you for 'store variable to global'! Didn't know that