GOV.UK now holds nearly 150,000 documents and services, so it's not always easy for people to find the things they need. One of the ways that people do this is using GOV.UK’s search box, and in this post I'll describe what we do to gather and analyse data when looking for ways to improve the search results.
There are two general questions we hope to answer with this monitoring:
How well is search performing?
How can we improve search?
Site search architecture
As well as the large search box on the homepage of GOV.UK, almost every other page has a small search box in the header.

When these are used to perform a search, a list of results is returned. We attempt to order this list such that the most useful results are at the top of the search. We use a small Elasticsearch cluster to calculate the list of results, and an application called Rummager to control this cluster.
The entire site is served through a third-party content delivery network, which caches pages (usually for 30 minutes). Since our content doesn't change frequently this caching is applied to our search result pages, which means that even for very common queries our search infrastructure will only see one request for the search result page every half an hour.
In order to monitor how users interact with the site we have to get tracking information from somewhere closer to the user, and currently we use Google Analytics for this, which works by sending tracking information from a user's browser to Google's servers. Amongst other things, the tracking information includes:
- unique visitor and session IDs (based on a cookie stored in the browser)
- the page being viewed
- the title of the page
- the number of pages viewed so far in this session
- the source of the visit (ie, how the user got to GOV.UK)
We also add Custom Variables to the tracking information, which allow us to record things like the type of content on the page, and the organisations which are associated with the content on the page.
Google then aggregates and stores this information, and lets us query it in a wide variety of ways. We use the Google Analytics web interface to perform ad-hoc queries and build simple dashboards, and use the APIs to build more complex dashboards and perform bulk analysis.
We could perform some of this monitoring by accessing logs from the content delivery network, but this is somewhat inconvenient. Perhaps more importantly, these logs don't include any session-based information, so can't be used to answer questions such as "what is the average number of pages that a user views in a session involving site search".
Usage patterns
What does all this monitoring tell us?
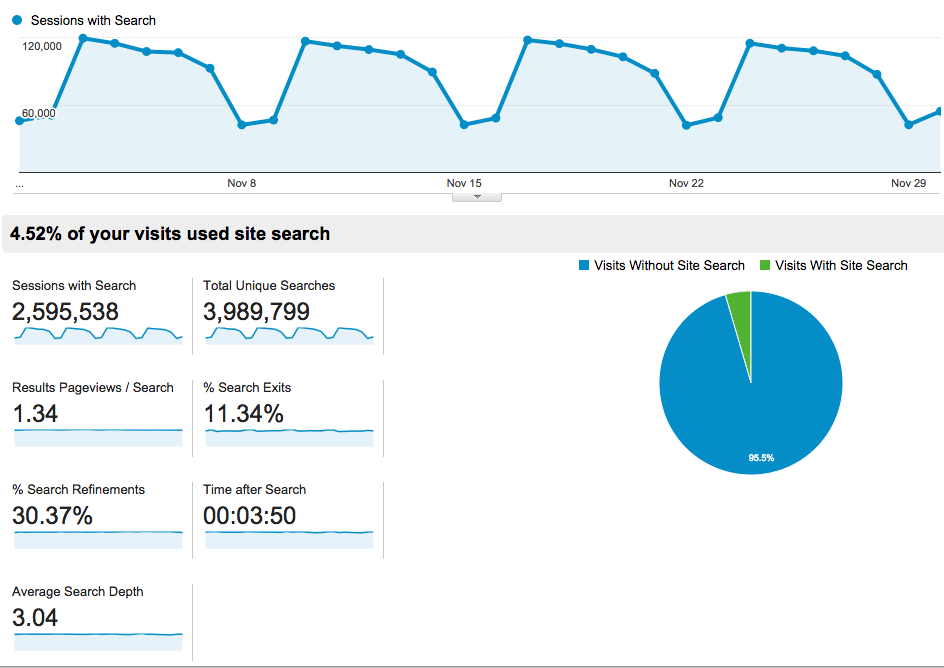
Google Analytics has a built-in overview page about site search. Here's part of the overview for all searches performed in November 2014:
This shows us lots of fun statistics:
- we perform nearly 1,000,000 searches each week
- we have a strong weekly traffic pattern (far fewer searches happen on Saturdays than Mondays)
- only around 4.5 per cent of sessions use the site search
- 11 per cent of searches are followed by a user leaving the site
- 30 per cent of searches are followed by a user changing the search they entered and trying again
Google Analytics will also tell us which are the top searches, and allow us to segment by search so that we can see how many pages people view after performing each search, etc.
The low proportion of sessions using site search is interesting. This figure is small, but slowly increasing (it was 4.2 per cent for the same month in 2013). Other reports tell us that the main way that people find content on the site is going directly to it from external sites and search engines, and half of sessions on the site consist of only a single page view. We're very happy with this: it's great if people can come to the site, read a single page, and get the information they need.
However, for these statistics to be much more than a curiosity, they need to help us to answer at least one of the two big questions:
How well is search performing?
How can we improve search?
Unfortunately, the statistics available by default in Google Analytics don't really help answer these questions, because it's hard to know whether a change in them corresponds to an improvement or a deterioration in search result quality.
For example, you might hope that if the "Search Refinements" statistic decreases it means we've improved the site search, because people aren’t having to modify their searches to find what they need. However, this could also mean that we're not showing the right results, and people are having to click on lots of results to find the item they're looking for.
In my opinion, the least ambiguous of the standard statistics available is the "% Search Exits". If this increases search has probably got worse, because this statistic tracks the number of people who leave the site after performing a search rather than who click on a search result. However, some of our search results go to documents on other sites, so a click on one of these is indistinguishable as far as Google Analytics is concerned from a user closing their browser and giving up.
Understanding changes in these statistics is particularly hard for a site like GOV.UK which has been growing rapidly over the last couple of years, with large amounts of new content, and new types of content, being added each week.
The best that tracking the default statistics can really do is to alert us to a change in site search performance, which we can then investigate to see whether things have improved or deteriorated.
Getting better information into Google analytics
One of the most useful pieces of information in tracking search performance is the position in the result list that people are clicking. We've managed to add this information to Google Analytics, but it's not possible to do this in a straightforward manner.
One approach would be to send an event to Google Analytics when a user clicks on a search result. However, as soon as the browser starts loading the result page, any events which haven't been sent yet will be discarded, so we'd either lose many of the events or have to delay navigation to the result page. Neither of these are satisfactory approaches.
Another approach would be to add something (such as a query parameter or a fragment identifier) to the URL of the result pages, and use this to set a custom variable when tracking the view of the result page. This is also unsatisfactory, partly because we believe that having readable and clear URLs is important, but also because adding such parameters would have side effects such as breaking caching.
Instead, we use an onclick handler on the search results page, which sets a cookie when the result link is clicked. This cookie is checked whenever a page on GOV.UK is loaded, and if it's set the information in it is recorded in a custom variable. The cookie is then immediately cleared. This mechanism allows us to associate information about an event which happened on a previous page with the event we send to Google Analytics.
If you're interested in the implementation of this, the code which sets the cookie is held in our frontend app and the code which reads the cookie is held in our static app.
Why we want click positions
The importance of position in analysing click behaviour is perhaps best illustrated with a graph.
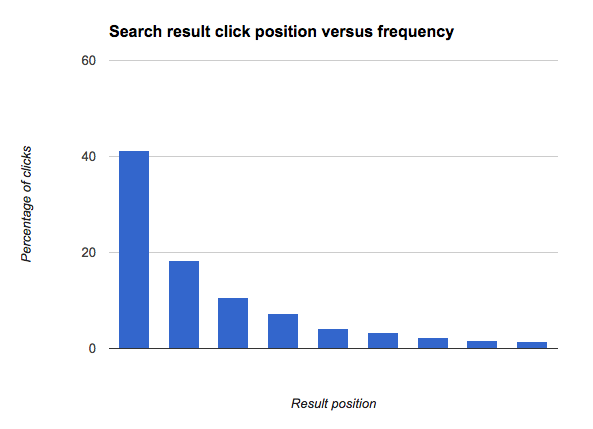
This shows that the top result in the list of search results gets clicked more than twice as much as the next result; and that there's nearly as big a proportionate drop from position 2 to position 3, etc. In other words, there's a very strong bias towards clicking the top results.
A simple model of what is going on is that there are two factors influencing how likely a user is to click on a result:
- how well a result appears to match the query ("Quality bias")
- how much the user trusts the system to have picked a good result ("Trust bias")
This has been extensively studied in the past. For example, this paper on Accurately Interpreting Clickthrough Data as Implicit Feedback compares eye tracking and click behaviour, combined with presenting result sets in ascending or descending order, to distinguish the two effects.
When we look at the click positions for a single search, say for "Visa", we often see a clear deviation from this pattern:
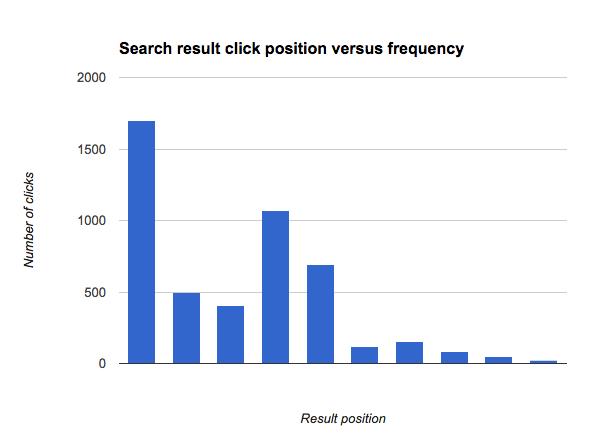
This indicates that there is a problem with ranking for this search: the results shown at positions 4 and 5 get more clicks than the results shown at positions 2 and 3. In fact, we'd normally expect all results after the first result to get less than half the amount of clicks that the top result gets, but the result shown at position 4 is getting more clicks than this, so it's probable that if we showed it at position 1 it would get more clicks than the result currently shown at position 1.
Dashboards
Having these analytics available is all very well, but if we can't easily refer to them it's hard to use them. So, we've implemented several dashboards to show us how search is performing.
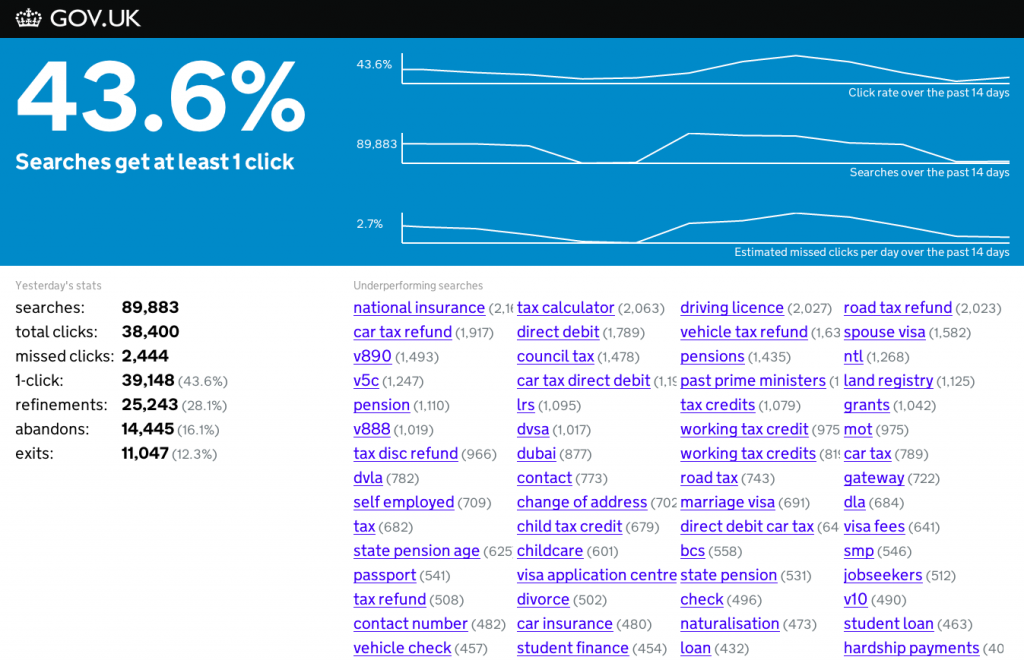
Search performance overview dashboard
This dashboard is shown on a screen in our office and has two parts: indicators, and specific problems.
It’s generated by a set of Python scripts which run daily to download the previous day's data from Google Analytics. They process the data to extract a few top level "key performance indicators". The primary metric, "1-click", shown at the top left, measures how many of the search result pages shown resulted in at least one of the results being clicked. Since we don't usually show enough information on a search result page to answer a user's query in full, the higher this number is the better.
As well as usage metrics, we also show a few other indicators which are a bit harder to interpret:
- "refinements": the number of searches which are followed by a new, modified search.
- "abandons": the number of searches which get no clicks, but are followed by navigation to somewhere else on the site.
- "exits": the number of searches for which we get no click information, and are followed by the user leaving the site. As discussed earlier, this includes clicks on results which lead to pages which aren't on GOV.UK.
- "missed clicks": this is a very approximate estimate of the number of extra result clicks we might have received had we ordered our results better. This is based on how the position information for each query deviates from the expected pattern.
The main way we use these indicators is to warn us if something has changed; we'll then investigate changes further. The metrics also allow us to deploy changes with confidence that we'll know if we accidentally make things worse.
The bottom right panel on the dashboard lists queries which we've identified as having problems with their ranking, based on the click positions. We can often solve such problems very quickly once the dashboard makes us aware of them; sometimes with specific fixes such as content tweaks, and sometimes with more generic fixes which will improve a wide range of queries.
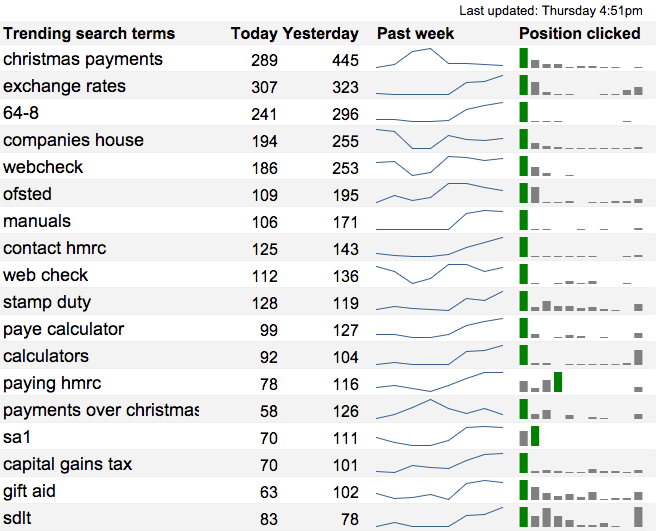
Trending searches dashboard
This dashboard shows searches which have recently happened more than usual. This is very useful to help us keep an eye on new searches, which has been particularly important as websites have been transitioned onto GOV.UK.
The dashboard includes a bar chart for each query indicating the click positions for that query. This helps to identify poorly ranked queries at a glance.
This dashboard is actually an automatically updated Google spreadsheet, using the Google Analytics spreadsheet add-on. It does some fairly complex processing, but was set up by a performance analyst without needing to do any "traditional" programming.
Live searches dashboard
The live searches dashboard is very simple, and just provides a scrolling live stream of searches being performed on the site. The data is fetched from Google Analytics' "live" API using a bit of Ruby and Javascript.
The stream of searches is not only mesmerising, but also helps to give a flavour of the types and variety of searches on the site. This helps when thinking about approaches to take to improve the search system.
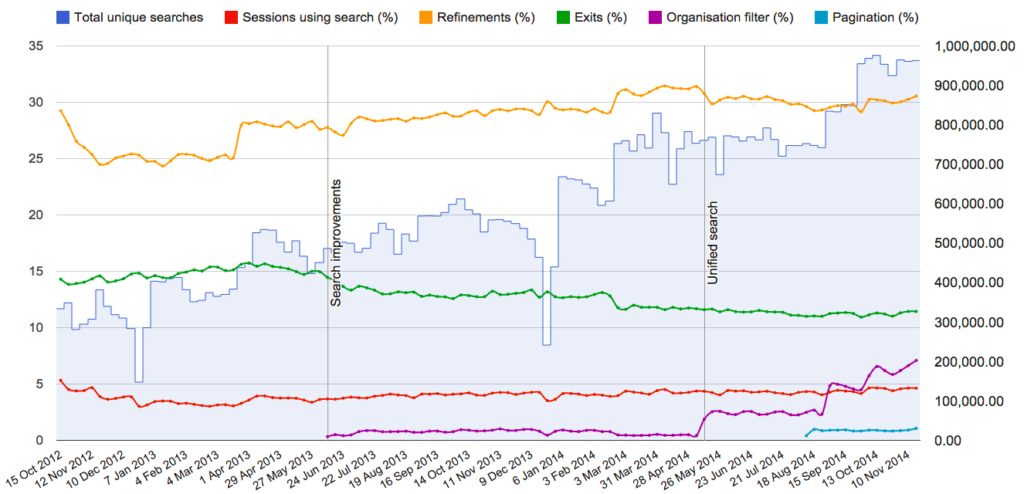
Weekly search metrics
At the opposite extreme of timeliness is the "weekly metrics" dashboard. This shows long term trends in search since GOV.UK launched.
Like the trending searches dashboard, this is entirely implemented using a Google spreadsheet.
What's next?
We've barely scratched the surface of what's possible using analytics data to improve search results.
Tracking click positions is very useful, but what's currently missing is details of which results are being shown at each position. This would allow us to calculate the proportion of times a result is clicked when shown at each position, and allow us to investigate the effects of relative ordering of results.
While it's clearly a powerful tool, Google Analytics has several drawbacks for performing this kind of monitoring: we would essentially need to encode a great deal of information into a custom variable, and pull it out again for external analysis. It's also difficult to answer questions such as "which pages did users ultimately navigate to after performing a search" with Google Analytics, so it may become more sensible to implement a separate tracking system for this kind of data.
Further reading
There is a wealth of literature on how to use analytics data to monitor and improve search.
A good overview is the issue in the excellent "Foundations and Trends in Information Retrieval" Journal on Mining Query Logs: Turning Search Usage Data into Knowledge, by Fabrizio Silvestri.


6 comments
Comment by Matthew Ford posted on
Another useful metric would be did the user search again without clicking on any of the results, as that would indicate they didn't find what they were looking for.
Comment by Richard Boulton posted on
Agreed, and that's what we try to measure here.
The standard "Search refinements" metric in google analytics actually records subsequent searches that happen in a session, regardless of how much activity happens between the searches. I find this makes it hard to determine a signal in the noise, so don't tend to use that metric most of the time.
The "refinements' metric we show on our dashboard is direct refinements - ie, refinements that happen on the search result page without any intermediate browsing. We obtain this by querying GA for 'previousPagePath' and 'pagePath' pairs which are both search pages: see https://github.com/alphagov/search-performance-dashboard/blob/a30dcdaf9c1f707bedc82005ed580aae361aa6ee/dashboard/fetch/ga.py#L305-L332 for the code. I believe this can get confused by use of the "back" button, but is mostly what you're suggesting.
Comment by Tony Russell-Rose posted on
Excellent article Richard. Wrt the discussion above, the IR community (at least the bit that I work in) normally uses the term 'reformulation' to describe a query that is modified within the same session. So "visa application" -> "visa application form" is a reformulation. A refinement, OTOH, is what happens when a user selects a facet value, e.g. doc_type="form". Talking of which, do you have any data on facet selections, or plans to roll out any other facets besides Organisation?
BTW I'm amazed that only 4.5% of users (apparently) use site search. How are sessions being identified (i.e. what critieria do you use to identfy the session boundaries)?
Comment by Richard Boulton posted on
Thanks for the note on terminology. Google Analytics' terminology rarely matches that used elsewhere.
We do have data on facet selections: they're not used very frequently, but if you look at the "weekly search metrics" screenshot, the purple line is the percentage usage of the organisation filter. That's a bit misleading, though, because in many cases we're now turning an organisation filter on automatically based on the page the search was started from. What's we really want is data on how often people interact with that filter, which we can also get hold of but haven't yet plotted on a nice dashboard. The main finding so far is that as things are, people barely notice the filter, even when it's active. We'll certainly be working on improving that in the new year, and rolling out other facets.
The 4.5% figure has to be considered in the context that many users don't browse around the site at all - so the percentage of users who are trying to find things on the site and turn to site search is much higher. That said, around 11% of sessions use the browse hierarchies on the site, and our regular "benchmarking" user research sessions also indicate that for many users their first instinct is to browse around the site. Our high level of traffic from mobile sources may also contribute, since it can be harder to enter searches on such devices.
I don't think it reflects that users have "given up" on site search or similar though, since the figure is if anything slowly growing.
Sessions here are based on Google Analytics' definition, which is essentially a group of interactions from a user on the site with a gap between interactions of no more than 30 minutes. Referrers from third party sites (such as when a user goes to google to search and then comes back from a search page) will also usually be interpreted as starting a new session.
Comment by Jose Gaspar posted on
Can we know what solution do you use to store the documents?
Comment by Richard Boulton posted on
We store the search index in ElasticSearch. The documents themselves are stored in a variety of applications (mostly public code under https://github.com/alphagov), which generally use one of MongoDB, MySQL or Postgres as databases, depending on requirements.
There's no fully up-to-date listing of our tech stack since it changes frequently, but it looked like this https://gds.blog.gov.uk/govuk-launch-colophon/ two years ago.