The GDS Reliability Engineering Observe team helps service teams across our department to effectively anticipate, detect and respond to system problems as quickly as possible.
We do this by helping teams use our monitoring and alerting service, which uses the open source monitoring tool Prometheus. We’ve found that using service mapping and user research has helped us to create and improve our service.
Here’s an overview of problems we solved with our service, how it works and updates we’re planning to make.
Monitoring and alerting problems across GDS
GDS teams use a variety of tools for monitoring and alerting purposes including Sensu, Icinga, Datadog and Graphite. This can cause complexity because even if teams only use Graphite it is possible to run tool in different ways, either by self-hosting or through a SaaS provider. We found using these different approaches to monitoring and alerting across GDS is not ideal because:
- it can be difficult to set up tools
- guidance on good practice is hard to find online
- developers cannot share knowledge between teams
- developers have to learn to use another product if they move between teams
Building a multi-tenancy monitoring and alerting service
To solve the department-wide problems, we built an internal monitoring and alerting service for GDS teams who run their infrastructure on the GOV.UK PaaS. We use a multi-tenancy model, which means GDS teams using our service can view each other's metrics, alerts and dashboards. This helps to increase consistency and means teams can learn from each other.

Our monitoring and alerting service works by using:
- Prometheus to collect metrics from services
- Alertmanager to handle alerts from Prometheus
- a Cloud Foundry service broker on the GOV.UK PaaS to determine which apps should have their metrics collected by Prometheus
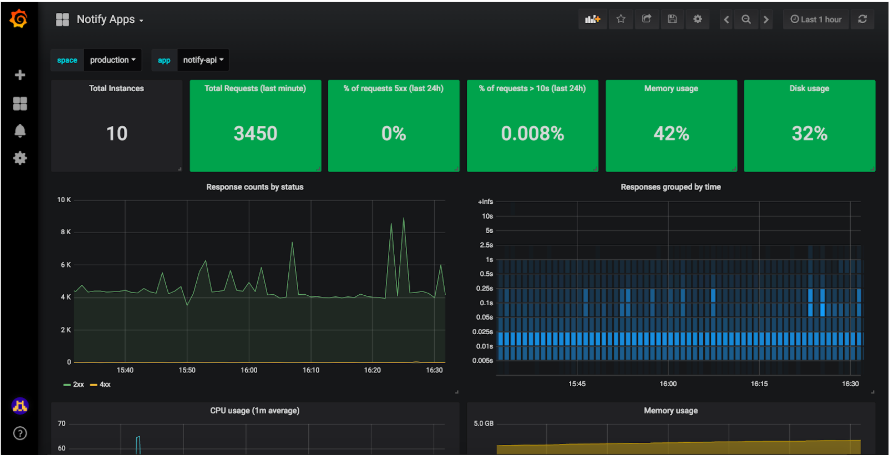
- Grafana to display metrics on dashboards
- tools like Pagerduty and Zendesk to deliver alerts to teams
We provide teams with applications hosted on the GOV.UK PaaS with Reliability Engineering documentation to help them set up their monitoring and alerting.
Testing the documentation for our service
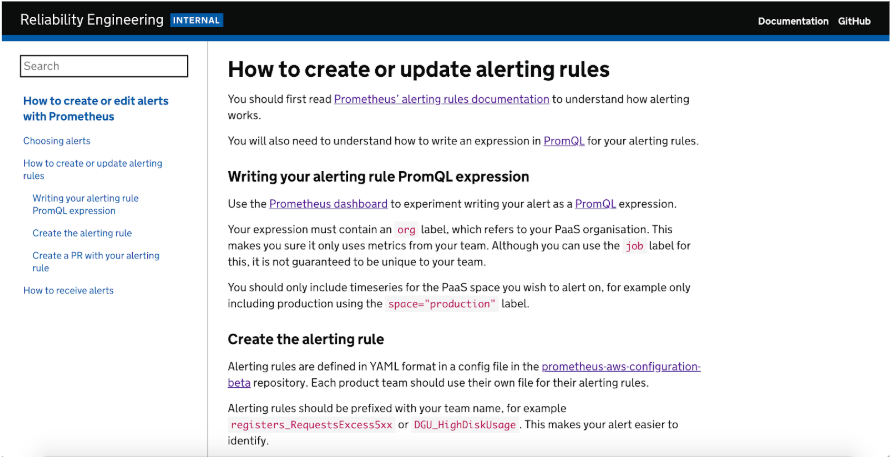
One of the more complex aspects of using Prometheus is creating and updating alerts. We wrote and tested documentation to create and update alerts with 2 teams: data.gov.uk and GOV.UK Registers.

Here are some of our findings.
1. Relevant metrics are sometimes difficult to identify
During testing, users were not sure which metrics would let them write their alert. Users also did not know whether Prometheus had access to the relevant metrics they needed without taking additional steps to make metrics available from their application.
Our participants used the 'insert metric at cursor' drop down as a way to explore which metrics were available in Prometheus. The drop down listed 650 metrics, most of them related to Prometheus or metrics from other teams. Users found this list overwhelming.

We plan to update our documentation with an expression to retrieve all the metrics related to a specific GOV.UK PaaS organisation. For example, to help GOV.UK Notify developers find metrics relevant to them, they could use the following query:
<span style="font-weight: 400">sum by(__name__) ({org="govuk-notify"})</span>
Unfortunately, this query will not return results in alphabetical order (other users have already discussed this with the Prometheus team) but this is a starting point to help our users find the relevant metrics.
2. Users were surprised by the behaviour of alerting expressions
We wanted to test if users could write alerting expressions following our documentation. We learned 3 things when testing this.
- Our documentation first encouraged users to read the official Prometheus documentation to get a general understanding of how alerting works and how to write an alert using the PromQL language. However, we found users jumped straight into writing their alerts without reading this external information.
- Research participants began by copying and pasting existing alerting examples from GDS teams into Prometheus and used these examples as a starting point to write their own alerting expressions.
- Our participants were confused when the alerting expressions they copied and pasted into Prometheus did not show what they expected. Users thought they would see some metrics or a boolean result but instead got no results.
For example, one user copied the alerting expression ‘disk_utilization{org="openregister",space="prod"} > 80’ into Prometheus. However, this returned no results because there were no disks using over 80% of space. The user was not aware that they had to tweak the alerting expression to remove the threshold (>80) to see any results.
Users were so confused by the lack of results, they struggled to continue writing their alert. We had to show participants how to edit the expression to see results so they could understand how Prometheus queries worked.
We plan to add instructions into our documentation based on this feedback to make it easier for users to find the metrics they need and pick the appropriate threshold.
3. Our central review process was identified as a potential blocker
The Reliability Engineering Observe team currently manages all Prometheus alerts, which we define in our GitHub repository.
If a user wants to add or edit an alert for their service they have to wait for us to approve, merge and deploy their GitHub pull request. User feedback suggested this central review process was a potential blocker for teams as they would have to wait for us to review, merge and deploy their alert. However, we have decided to continue with this central review process for 2 reasons.
- Our code reviews flag coding errors, which we help to fix. We think these errors mostly occur because Prometheus and PromQL are new to many GDS developers who may be unfamiliar with system.
- We provide suggestions to help teams improve their alerts. For example, we suggested that data.gov.uk could link to dashboards and their runbook to make one of their alerts more detailed and easier to resolve.
We feel the benefits of a central review are worth the potential cost of slowing service teams down. We’ll review our process regularly and as teams become more familiar with Prometheus the process could change.
What we’re working on next
Over the next few weeks we’ll start working on the changes we’ve discussed to make it easier for developers to create alerts. We’ll then do another round of user research to test these changes.
As GDS developers become more confident with Prometheus, future testing will help us to check if our documentation is still fulfilling user needs. Continuous testing will also help us to see if our documentation is the best way to solve different user needs or whether we have to look at other options like:
- providing training sessions for developers
- changing our Prometheus configuration
We’d love to hear about how Prometheus users across government and industry have tackled similar problems.
Get in touch with us below or sign up to the next Prometheus London meetup on 14 November.
