
Like all websites, GOV.UK sometimes experiences technical difficulties. These can be caused by bugs in code, unexpected inputs, heavy system load, or any combination of the above. Issues like these are inevitable. What we can control is how we spot and resolve them quickly.
In recent months, we’ve reduced our error count by over 90%. This has already enabled us to discover new issues which were previously lost in the noise. We’ve also improved the developer experience by integrating error reporting with Slack and improving our documentation. We’ve engaged with other teams to encourage a targeted approach to Slack alerts, to keep our overall error count low.
How we track errors
At GOV.UK, we track errors using an external service called Sentry. This is a monitoring platform that logs unexpected things occurring on GOV.UK. It gives us detailed information for each event, and this lets GOV.UK developers work out what the issue is and how to resolve it. Other monitoring tools are available; for an explanation of why we chose Sentry, see this discussion on GitHub.
We found that we were getting an extremely high number of errors each week, making it hard to navigate Sentry. The high number of errors also meant that Sentry was not storing all of the errors we were sending, as there is a cap on the number of events Sentry will allow per hour. Events over the threshold get discarded (‘rate-limited’), giving developers no information to go on, and in the worst case scenario, no indication that there is an issue at all.
We needed to reduce our error count on Sentry to bring us under the rate limit, and to make sure we could spot and deal with new issues as quickly as possible. This blog post explains the 3 steps we took to do this and how we reduced our error count by over 90%.
What we wanted to improve
While GOV.UK looks like a single website, it is actually formed of over 50 frontend and backend applications which are hosted and maintained independently. For much of 2020, we were regularly logging 100,000 to 200,000 weekly errors across these applications. This sounds extremely high but many of these could be attributed to a handful of distinct ‘issues’. Sentry groups events into issues, making it easy to quantify how often the problem occurs. It is also possible to write comments on issues, and assign issues to developers.
The high number of issues made Sentry noisy. This wasn’t helped by the fact that a lot of the issues seemed to be duplicated, with issues with the same title appearing multiple times in the list. We wanted to investigate how Sentry groups its issues to see whether we could configure it to do a better job.
The high number of issues was exacerbated by having one shared GOV.UK Sentry account for all of our environments. An issue on a test environment could bring us over the rate limit and therefore hamper logging on production. It was critical that we reduce the number of events we send to remain below the threshold, so that issues wouldn’t get lost in the system.
Finally, we needed a preventative strategy to stop the number of events from creeping up again.
Investigating Sentry grouping
By default, Sentry groups issues by stack trace, and if no stack trace is available, it will also look at the exception type/message. However, Sentry also allows you to customise how you group issues, by specifying your own fingerprinting algorithm, or changing the setting in the user interface.
We investigated whether custom grouping would be beneficial, by auditing all unresolved issues and considering which ones should be grouped. Our audit showed many of the issues that looked like duplicates actually referred to different controllers and templates, so were in fact separate issues, even if they looked similar.
The audit did highlight one problem: some duplicate issues resulted from harmless dependency upgrades, because the file structure of the dependency would change slightly, changing the stack trace (which Sentry uses to group issues). Really, these ‘framework traces’ aren’t very helpful for issue grouping; what we care about is the ‘application trace’.
It is possible to ‘clean up’ the stack trace prior to sending it to Sentry, but doing so would cause the original stack trace to never get logged, losing valuable diagnostic information. We’ve raised a feature request with Sentry to use only the application trace for issue grouping, whilst still logging the full stack trace.
We concluded that, on balance, Sentry’s default grouping algorithm works quite well for us.
Reducing the events sent to Sentry
To recap, we were logging too many errors, which meant that we had no visibility of errors that occurred over the rate-limit.
We created a Grafana dashboard to monitor our errors in Sentry over time, so we could measure how well we were tackling the problem. We also created a separate dashboard for errors in what was our most error-producing application.
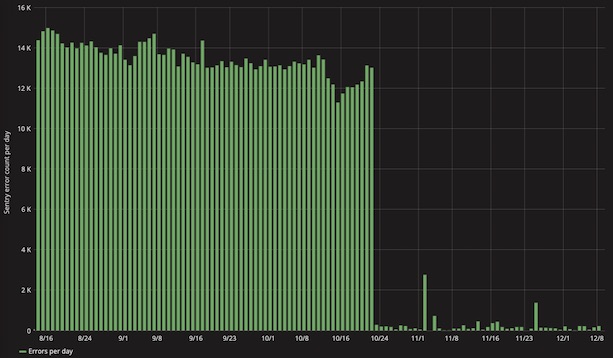
This application was consistently logging almost 15,000 errors to Sentry every day. Though high in volume, most of the errors were attributed to a single issue, which only appeared to be happening during the nightly data sync.
Every night, all content on GOV.UK gets copied to our staging and integration environments. This is achieved by dropping and re-creating databases, meaning that some services on these environments can be temporarily unavailable, and any attempt to make a call to them results in an error. These particular errors are harmless, expected and unactionable, so we wanted to stop them from being logged to Sentry.
We decided to implement a new configuration option: a list of exception types that should be ignored if they occurred during the data sync. This was added into our GovukError module, which our applications use to interface with Sentry. The effect was immediate: errors in the most error-producing application dropped by 98%.
We continued to audit Sentry, writing up the most prolific issues for developers in the Platform Health team to work on, then ‘ignoring’ the issue in the Sentry user interface. This meant the errors were still being logged but were no longer as visible, which helped reduce the noise and enabled us to spot new issues as they arose. We’d ‘resolve’ the issue once we’d fixed the problem: this is a useful mechanism as Sentry emails the resolver of the issue if the problem comes back.
Over time, we resolved the highest volume issues and made other improvements to our default configuration, such as only allowing errors from particular environments. We also became more particular about what should get logged in Sentry, only allowing actionable system errors, and not, for example, errors caused by the user.
We succeeded in bringing our overall error count far below the rate limiting threshold. Our best week was in March 2021, where we logged just 5,500 errors; a significant reduction on the more than 100,000 errors we were regularly seeing beforehand.
We now needed to start thinking about a preventative strategy, to avoid error counts from climbing again.
Preventative strategy
Whilst all of our developers have Sentry access, they typically only log into Sentry during an incident, or to keep an eye on the health of an application when deploying. This makes it easy for new issues to creep in unnoticed.
Sentry has a Slack integration which sends notifications when events occur, according to configured alert rules. We created an alert to notify us when an issue occurs more than 100 times in the space of 60 minutes. We’ve found that this strikes the right balance, as it prioritises our worst errors whilst avoiding spamming the channel. We hope to gradually lower this threshold so that we can work through the ‘long tail’ of issues.
One problem with these notifications is that they aren’t targeted: they rely on someone monitoring the channel and taking ownership of the issue. Many issues arise as a result of code changes made outside of our team, and it would be far more efficient to directly notify the team or developer responsible for the change. We’re therefore encouraging other teams on GOV.UK to set up their own Slack alerts for the applications that they regularly work on, which we hope will prevent the introduction of most new errors.
Next steps
In the short term, we next hope to improve the production alerts that page our second line and on-call developers when something on GOV.UK needs an urgent response. Beyond this, we’re thinking about how we might introduce more observability to GOV.UK: we’ve recently introduced Real User Monitoring, and are considering options such as Application Performance Management. Our ongoing replatforming project presents an exciting opportunity to design these processes from the ground up.