At GDS we work in quarterly missions. At the end of each cycle, teams have a firebreak to experiment and develop new ideas. Here are 4 things we worked on.
1. Building a better monitoring tool for GOV.UK PaaS
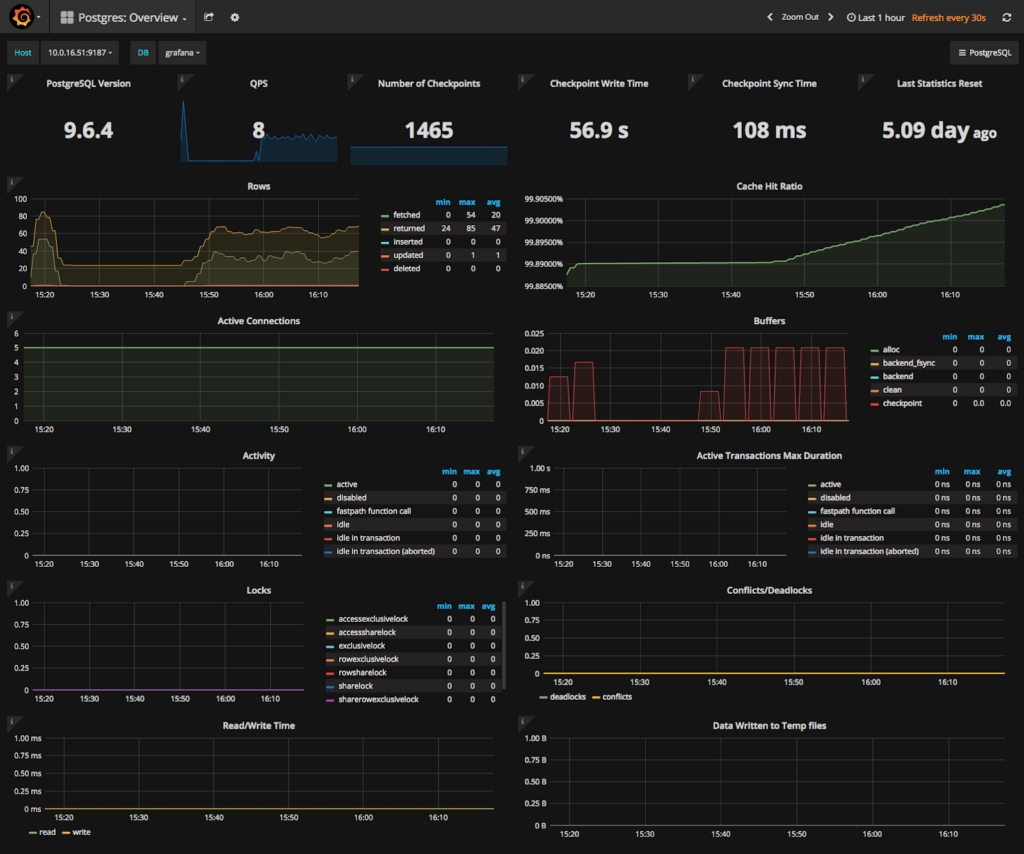
One of our aims for this firebreak was to begin work on a monitoring project for GOV.UK PaaS to measure performance, health and load metrics. As some of the GOV.UK PaaS team have prior experience with the open source monitoring tool Prometheus, which can provide a deep level of metric monitoring, we decided it would be a good fit for this project.
We started by deploying a BOSH release of Prometheus from the Cloud Foundry community by using the upstream manifest file for the basic layout. This let us deploy multiple components and keep them all synchronised. Next, we added an OPS file to customise the Prometheus deployment to fit in with the configuration of virtual machine types we currently use.
After deploying Prometheus, we discovered it was not by default a high availability (HA) deployment. This meant we had no redundancy. And, when we explored our Prometheus deployment, it also became clear we weren’t receiving any performance metrics from our machines that run user applications. So, one of the first things that we needed to do was correct this lack of metrics.
We were able to push component machine level metrics into Prometheus by deploying the Node-exporter plugin to each one of the components of the PaaS. From here, we were able to see the health of the GOV.UK PaaS itself and the applications running on it.
We found that using Prometheus for monitoring gives us 3 benefits. It allows us to:
- identify unhealthy apps
- see the underlying cause of any issues
- collaborate with a huge community as contributions are made from public and private sector organisations globally
We’re scheduling our Prometheus deployment to go live later in the year.

2. Creating a live infrastructure map
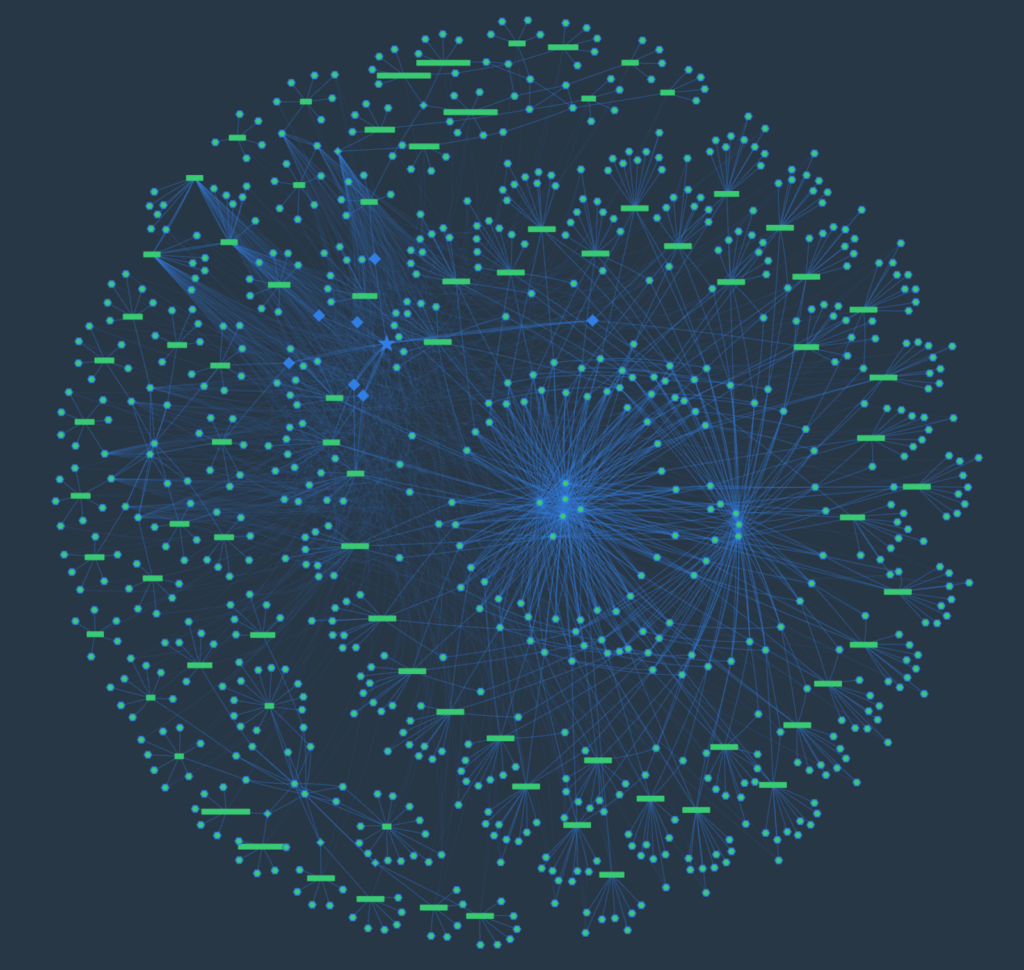
New starters on the GOV.UK PaaS team often find it hard to understand the infrastructure behind our Cloud Foundry deployment. Cloud Foundry is a fast moving project, so it’s difficult for team members to remember which component runs on which instance. To solve this issue, we decided to create a live visual representation of what was running and where. The aim behind this was to save the developers time when on support.
The PaaS Infrastructure map is still a work in progress. We aim to increase functionality in the future by adding:
- critical applications running on the platform
- deployed services such as Relational Database Service instances
- load distribution across the platform cells

3. Improving our workflow tooling
The third thing we did was spend some time improving our workflow tooling. As there are 3 teams within GOV.UK PaaS, it can be difficult to keep track of everything that’s happening. We wanted to see if improving our tooling could help make things clearer.
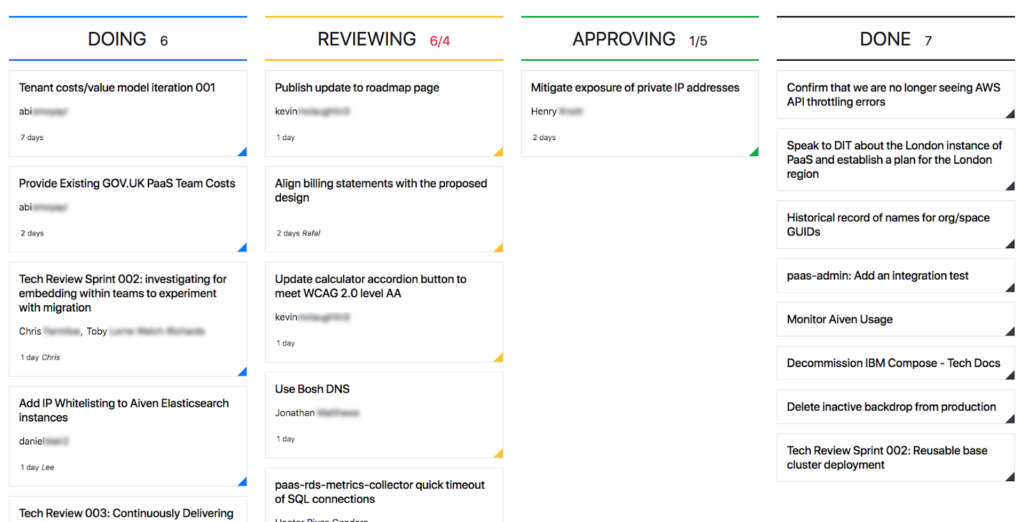
To keep on top of our development workflow, the GOV.UK PaaS team uses a tool we’ve created called Rubbernecker It’s connected to a Pivotal Tracker, and uses the Pivotal API to pull in data around the stories we’re working on and display the workflow in a clean and easy to read format. Originally, we wrote Rubbernecker in Node.js. However, the tool has proven to be limited in functionality and only displays current stories in progress, review and acceptance. As only a few team members were familiar with Node.js, it was also difficult for all of us to iterate it. In this firebreak, we decided to have a go at fixing these things.
We started by rewriting Rubbernecker in the Golang language, which was familiar to all our team members. The original Rubbernecker didn’t include a ‘Done’ column to show work that had been completed. So we added one in, adjusting the layout to account for its extra width. Once this was complete, we also had to add a new query against the Pivotal Tracker API so Rubbernecker could show finished tasks from the past 5 days.
To help distinguish the work each of the three teams are doing, we added a filtering feature to Rubbernecker. To do this, we had to find a way to tag the tasks in Pivotal Tracker and have the resulting data available via the API. We settled on using labels to make the tags, as we already had a pattern for blocked tasks and those with comments to resolve within the Pivotal Tracker.

We also fixed a couple of bugs in Rubbernecker. We started by fixing the lack of caching on the Pivotal Tracker API to stop errors occurring when too many people used Rubbernecker at the same time. We also updated the user interface to improve accessibility.
Rubbernecker is now written in a programming language the team is comfortable with and has a clean user interface. The system caters for our new team structure, lets us focus on the stories relevant to the teams and we can add new features quickly.

4. Migrating the team manual to a new format
Our GOV.UK PaaS team manual was hosted on Read the Docs using their native template. We chose to host our manual externally instead of on GOV.UK PaaS so we could still access the content in the event of an internal outage. However, the template was not in our house style and we wanted to move to the GDS technical documentation template, which has the appropriate branding and is maintained by the GDS community.
This template provided a single page format for technical documentation, however due to its increasing length we wished to move to a multipage format - a desire also supported by the tech writing community.
We were able to migrate existing content into the template quickly as both templates use Markdown. However, quite a large part of the work was in formatting updates and title tweaks.
During the migration we found lots of broken links due to the difference in how pages were routed by each application. We used a link checker early on to report broken links so we could identify and fix them. We also added new features to help handle large documentation, including a search functionality.
We have a culture of updating our public facing documentation on a regular basis. By migrating our team manual to a familiar and frequently updated format we hope to continue doing this.
What are we doing with the output?
We feel the firebreak was a really useful way for us to solve problems and innovate outside of our planned missions. As a result of this firebreak:
- Prometheus is scheduled to go into production later in the year and we will run it in parallel with our existing metrics monitor while we fine tune the alerting rules
- Rubbernecker is in production and our team uses it multiple times per day
- the GOV.UK PaaS team manual is live and in use
- we’re working on our live infrastructure map
Stay up to date with all the latest posts by signing up to alerts from Government Technology blog and follow Lee on Twitter.

1 comment
Comment by Jenny Mulholland posted on
Sounds like a great use of a firebreak 🙂